Simple Linear Regression
Table of Content:
Simple Model
Consider the dataset provided.
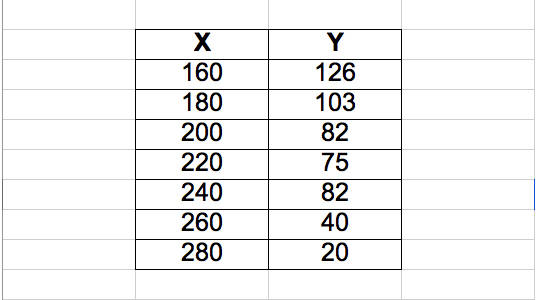
The first column provides the price of the house and the second column provides the number of houses sold. You want to fit a model where the price of a given house can predict the number of houses sold.
Let's see how to fit a model in the next set of cards.
Plotting the data
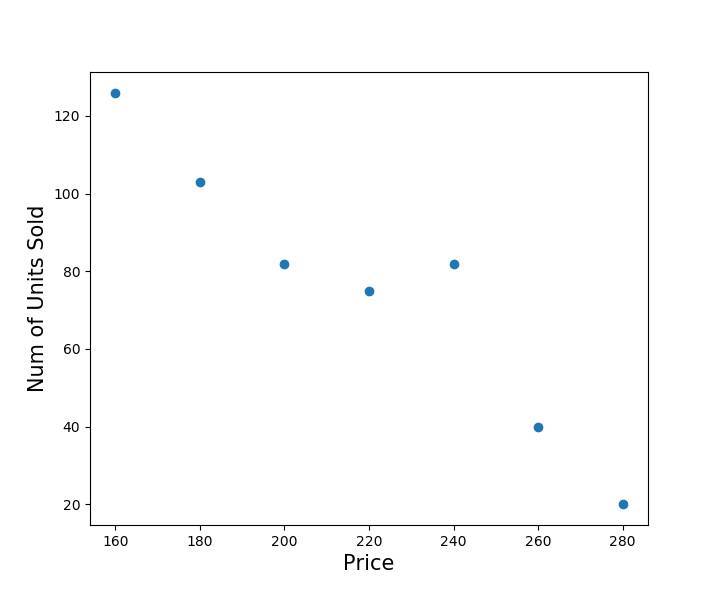
The X axis represents the price of the house and the Y axis represents the number of houses sold.
Using Mean as a Prediction Model
-
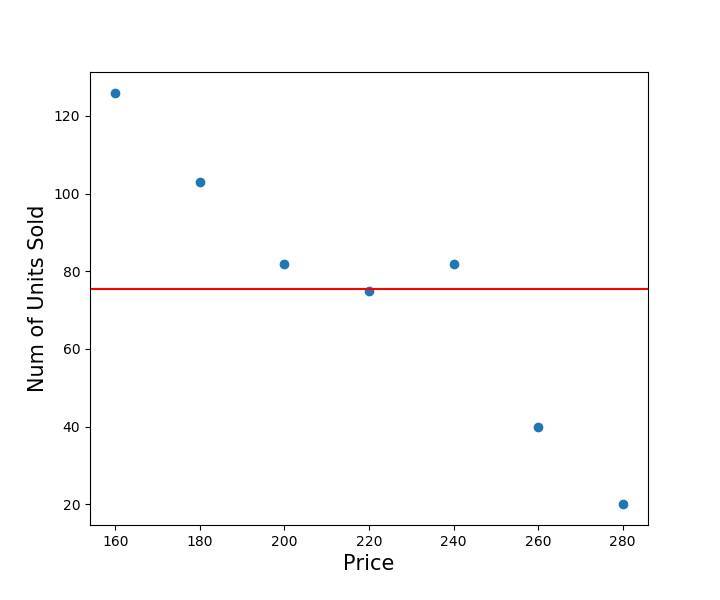
One way of predicting the number of houses sold is by using the arithmetic mean . This is the Base Model.
-
Irrespective of the price of a given house, the number of houses sold will be a **constant ** according to the model.
-
But does the mean describe the data well ?
Alternate Model
-
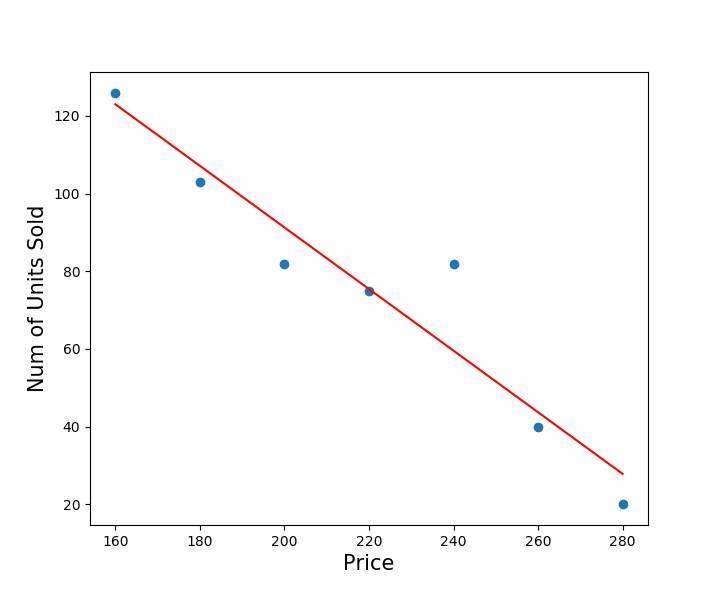
In this model the line describes the data better than the mean.
-
Is this the best model?
-
If this is the best model why is it not passing through all the lines ?
-
So, what is the error ?
Best Model

-
There is no straight line that can pass through all the points.
-
So ,how do you determine the best model ?
-
The best model is one that minimizes errors across all points . So you should take one line that minimizes the error across all the points.
Model Representation
$$y_i = \beta_0 + \beta_1 x_i + \epsilon_i$$where:
- \(y_i\) is the response variable for the
i-th observation - \(\beta_0\) is the intercept parameter
- \(\beta_1\) is the slope parameter
- \(x_i\) is the predictor variable for the
i-th observation - \(\epsilon_i\) is the error term for the
i-th observation
-
y- Dependent variable -
x- Independent variable -
e- Error measure -
B0andB1Parameters that best fit the model
Best Model Diagram
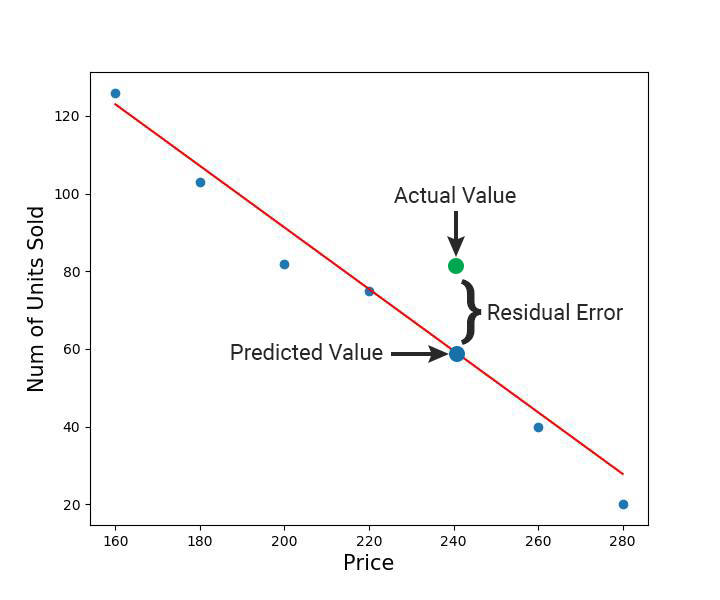
In this diagram,
-
The actual values are scattered and the predicted values are along the line.
-
The difference between actual and predicted values gives the error. This is also called the residual error (e).
-
The parameters (Beta0 and Beta1) are chosen to minimize the total error between the actual and predicted values.
Measure of Quality
-
You have seen how to fit a model that best describes the data. However, you can never get a perfect fit.
-
How will you measure the error/deviation in a model that is fit to the data ?
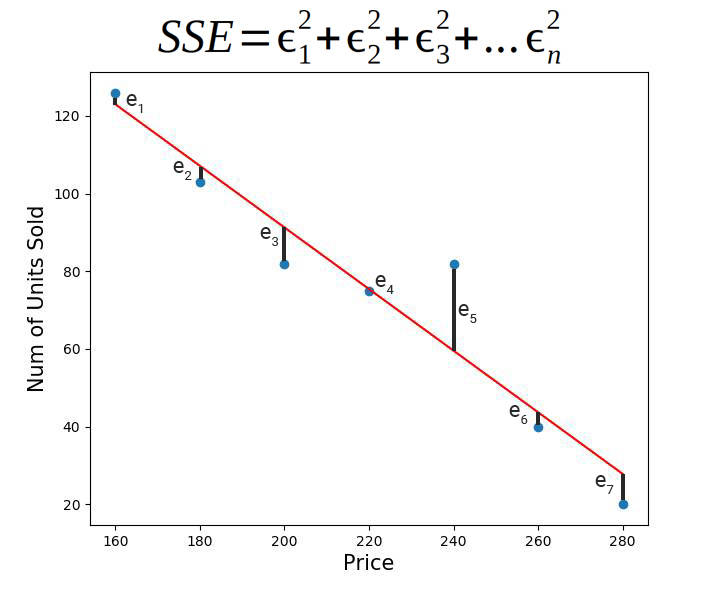
Sum of Squared Errors
-
Sum of Squared Errors (SSE) is a measure of the quality of the Regression Line .
-
If there are
ndata points, then the SSE is the sum of square of the residual errors . -
SSE is small for the Line of Best Fit and big for the baseline model.
Best Fit Line
-
The line with the minimum SSE is the Regression Line. SSE is sometimes difficult to interpret because,
-
It depends on the number of values (n)
-
The units are hard to comprehend
-
So, is there a better way to gauge the quality of the Regression Model ?
RMSE
$$RMSE = \sqrt{\frac{1}{n} \sum_{i=1}^{n} (y_i - \hat{y}_i)^2}$$ $$RMSE = \sqrt{\frac{SSE}{n}}$$At times, the SSE is difficult to interpret and the units are difficult to comprehend. So, the alternative measure of quality is the Root Mean Square Error (RMSE).
RMSE shrinks the magnitude of error by taking the square root of SSE divided by the number of observations (n).
Best Model Vs Baseline Model

-
The baseline model gives the Average value.
-
The SSE values for baseline model is the Total Sum of Square values(SST)
-
RSquare = 1 - ((SSE) / (SST))
R Square(R Sq) Properties
-
SSE and SST values should be greater than zero.
-
R Sq lies between 0 and 1.
-
R Sq is a unit less quantity.
-
R Sq = 0 means the model is just as good as the base line and there is no improvement from the baseline model.
-
R Sq = 1 means it is a perfect model. Ideally, you should strive towards getting the R Sq close to 1 . But some models with R Sq = 0 are also accepted depending on the scenario.
Model Interpretation
This is the equation for line of best fit
-
y = 249.85714 - 0.7928571x -
For a unit change in
Xthere is a.793decrease inY -
For a unit increase in price of the house,
.793lesser houses are sold . -
B0is249.85714 -
B1is-0.7928571